Written in the first person by ORIN’s founder; published under the house byline.
Yes — and no. And the difference between those two answers is where your money lives.
I’ve traded manually for four years and I built ORIN, an AI chart analysis tool. So I have every incentive to tell you the AI wins. Instead I’m going to show you one month of our own platform data — 750 real analyses from 97 traders — including the numbers that flatter us and the ones that don’t. Because if you’re new to trading and you read a headline like this one, the most dangerous thing you can conclude is “great, I don’t need to learn charts — the AI will do it for me.”
It won’t. Here’s what it actually does.
What “reading a chart” actually means
Before we score AI against humans, let’s define the contest. Reading a chart is really three separate jobs:
Perception — seeing what’s on the chart: the trend, the levels where price repeatedly stalled (support and resistance), the places where clusters of stop-losses are sitting (liquidity zones). Measurement — checking how many independent signals agree with your trade idea. Traders call agreeing signals confluence: trend direction, a structure break, volume, momentum, all pointing the same way. Judgment — deciding whether this specific trade, right now, in this market, is worth your money.
AI is superhuman at the first two. It is not built for the third. That distinction is the entire answer to the question in the title. If you want the machinery behind the first two unpacked properly — pixel readers against data readers, and what neither can see — the companion piece on how AI chart analysis works takes it apart in detail.
Where I failed for four years
My method was pure technical analysis. I could draw support and resistance in my sleep. My two recurring failures were subtler. I’d miss a confluence — usually a liquidity zone I didn’t spot until price had already swept it and reversed on top of me. And I’d skip checking higher timeframes entirely, because I was scalping on the 5-minute chart and felt confident I’d be in and out before the bigger picture mattered. (A higher timeframe is just the same chart zoomed out — the 1-hour or 4-hour view. A trade that looks great on the 5-minute chart can be swimming directly against a strong trend that’s obvious one zoom level up.)
Neither mistake came from not knowing better. I knew both rules. I just didn’t check them every single time. That gap — between knowing a rule and applying it on every trade — is where AI genuinely beats humans.
A real example: the trade the AI wouldn’t let me take
In August I lined up a short on BTC/USD on the 5-minute chart. To my eye it was clean: downtrend intact, a fresh break of structure at 79,750 (price closing below a prior pivot — a standard continuation signal), and a tidy entry shelf at 79,881. Everything I look for in a short.
ORIN graded it a C, confidence 40 out of 100, and returned NO TRADE. Its reasoning, verbatim from the saved read:
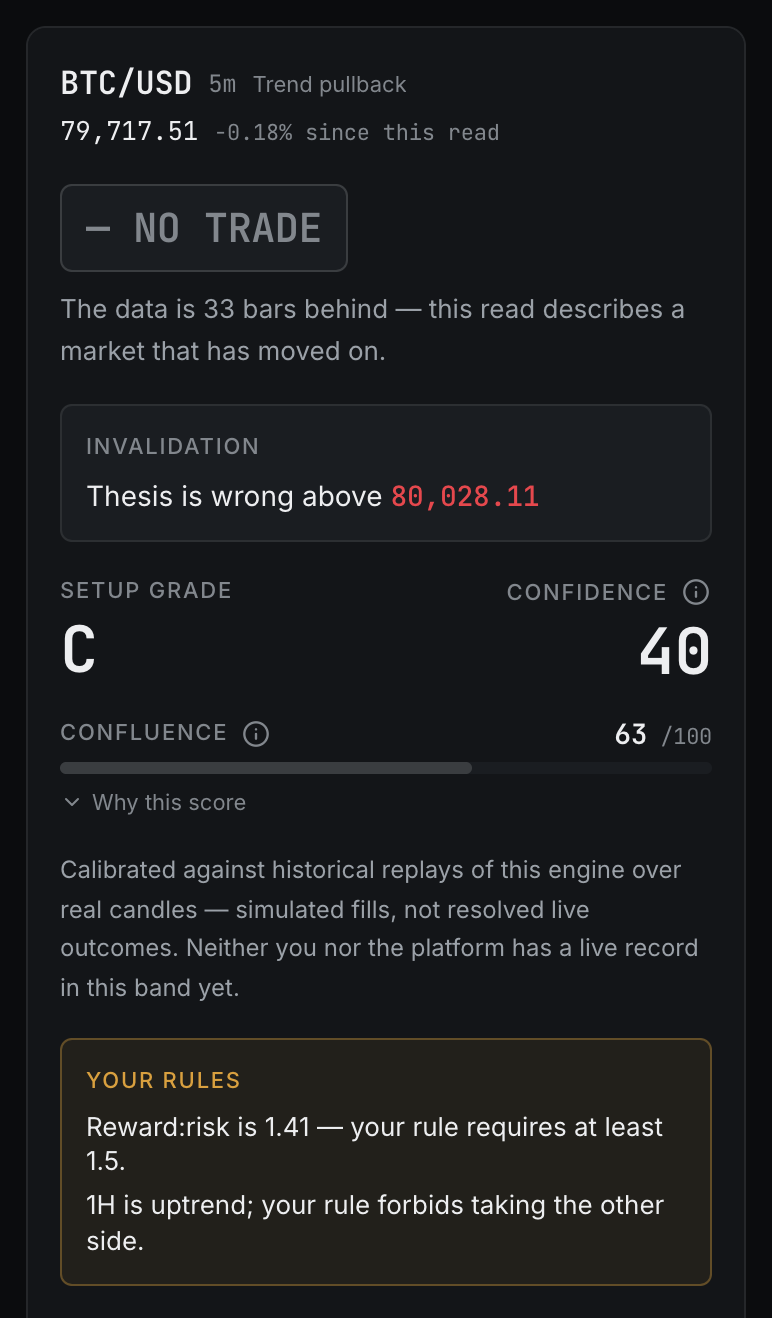
Read that again. The engine saw everything I saw — the downtrend and the break of structure are the first line of its own thesis. It scored nine separate factors, weighted them, and then let two of my own written rules veto the whole setup. The 1-hour chart was in an uptrend and my rulebook says never short into a higher-timeframe uptrend. The reward-to-risk ratio (how much you stand to make per dollar risked) was 1.41 and my floor is 1.5.
I would have missed the 1H check. I’d missed it a hundred times before. The AI cannot miss it, because it isn’t capable of feeling confident.
What one month of data actually shows
Between July 28 and August 28, 2026, traders ran 750 analyses through the engine. The numbers that matter:
41% of all reads came back NO TRADE. The single most common thing our AI says is “don’t.” 76% of analyzed setups violated at least one of the trader’s own stated rules — most often reward:risk below their own minimum (329 instances) or trading against a trend their own rulebook names (294 instances). Three out of four times, traders brought the AI a setup that broke a rule they themselves had written down. Only 3% of setups graded A or better. 24 out of 750. 44 setups were killed purely by higher-timeframe veto — the exact mistake I made for four years, caught mechanically every time. And traders listened: the setups people chose to take clustered in the B range and above, while the ones they passed on clustered in C and D.
Notice what’s not in that list: a win rate. Our live verified record is 33 resolved outcomes against the 100 the platform requires before its confidence scores lean on live results instead of backtested replays — and a backtest uses simulated fills, not real ones. Any AI trading tool waving a win rate at you from a sample that small, or from a backtest dressed up as live performance, is selling you noise. The honest case for AI chart reading is a process case: it applies every rule, every factor, every time. That’s the claim the data supports, and it’s the only claim I’ll make — the same standard our public calibration page holds itself to, where every cell stays empty until enough resolved outcomes sit behind it.
Where the AI lost, badly
Gold, earlier this year. XAU/USD was ripping upward and ORIN kept returning NO TRADE — by its measurements, price was overextended and the structured setup wasn’t there. Then a press release about Iran hit, fear flooded the market, and gold kept surging far past anything the chart structure implied.
The AI wasn’t wrong about the chart. It was wrong about the world. Geopolitical fear isn’t a candle; it can’t be measured until it’s already printed on the chart, and by then the move is gone. A human who understood what that headline meant could have ridden it. The machine, correctly following its rules, sat out a huge run.
That’s the trade-off in one story. The AI never forgets a confluence — and never understands a headline. Human intuition during unique events can dramatically outshine it, because humans can price fear and machines cannot. What the AI offers instead is something most traders, including four-years-of-experience me, never actually had: perfect consistency in following every step of a strategy.
“Can’t I just screenshot my chart into ChatGPT?”
You can, and for a quick second opinion it’s genuinely useful. But there’s a difference between talking about a chart and measuring one.
A general-purpose LLM sees your screenshot as an image. It has to infer the price levels, estimate where the swings are, and interpret what you’re asking — and it’s designed to produce a plausible answer from incomplete information. Ask “does this look bullish?” and it can build a convincing bullish case. Ask “why does this look bearish?” and it will often build an equally convincing bearish case from the same picture. It’s not lying to you; it’s doing what it was built to do, which is generate plausible interpretation, not proof.
ORIN works the other way around. A deterministic engine — plain code, same input, same output, every time — calculates the structure, levels, volume, and momentum from raw candle data first. The AI then explains those measurements, and every claim it generates is checked against them: a sentence citing evidence the chart doesn’t contain is deleted before you see it, and a read that cannot be supported is refused rather than padded.
That’s the real distinction, and it’s bigger than which AI is smarter: inference versus measurement. ChatGPT infers what your chart probably shows. A measurement layer establishes what it provably shows, then explains it.
Signal bots versus decision support
One more distinction, because the “AI trading” category lumps together two opposite things.
A signal service pushes trades at you. Its edge decays as more people trade it, and its business model quietly rewards you trading more — more signals, more action, more engagement. The CFTC’s customer advisory on AI trading schemes is short and specific about the claims to distrust, and the SEC has already settled charges over AI capabilities firms claimed and did not have. Decision support inverts the incentive: you find the setup, the AI grades it against your rules, and its most common output — 41% of the time in our data — is telling you no. One good trade can carry your whole week; you don’t need three a day. A tool aligned with that truth has to be willing to be boring, and a signal bot structurally can’t be.
The tagline on every ORIN analysis is the whole philosophy: you place the trade; ORIN grades the setup. The human keeps the final word — not as a legal disclaimer, but because the human holds the two things the machine doesn’t: intuition about events the chart hasn’t priced, and accountability for the money.
The finding I’d rather not publish
Here’s the part no AI-tool founder puts in a blog post.
In that same month of data, about 26% of analyses were the same person re-running the same symbol and timeframe within an hour of last doing so. The chart barely moved in most of those windows. That pattern — measured, not assumed — looks a lot less like seeking information and a lot more like seeking reassurance, especially while a trade is going the wrong way.
So I’ll say it plainly: used this way, ORIN is a crutch, and a crutch can stop you from learning to walk. The tool shows its reasoning on every read — the evidence, the factor scores, the “what would make this an A” line — precisely so you can absorb why a setup is good or bad. But showing the reasoning doesn’t force anyone to read it. If you use the grade as an oracle and skip the education, you’ll end up dependent on a machine you don’t understand, refreshing a NO TRADE like it’s a slot machine.
How to use an AI chart tool without becoming that user
If you’re a beginner, these are the rules I’d hold you to. The first four are standard risk practice, not ORIN features:
- Risk 1% or less of your account per trade. The platform shows you position size and dollar risk on every graded setup — actually obey it.
- One analysis per setup. No reanalysis while a trade is open. Your stop-loss and invalidation level were set when you entered; refreshing the grade mid-trade is emotion, not analysis. A quarter of last month’s reads say this rule is needed.
- Treat NO TRADE as the product working, not the product failing. It’s the most common output on purpose.
- Expect months of breakeven-at-best while you learn. Anyone promising otherwise is selling something.
- Learn to read structure manually, in parallel. Read the evidence trail on every analysis. Use the academy — it’s free — or any decent education, and check your own calls against the playbook’s worked structures. The goal is that six months from now, you predict the grade before you see it.
That last one matters most, because of the one thing no engine can ship as a feature: the platform cannot fix fear. Doubt, hesitation, panic-closing winners, holding losers — those are solved by confidence, and confidence comes only from knowledge you actually own. The AI can hand you a perfectly measured chart. It can’t make you calm while you trade it.
The verdict
Can AI really read trading charts better than you can? On perception and measurement — yes, decisively. It checks every factor, every timeframe, every rule, on every single read, and it never gets tired, bored, or convinced. In our data it caught traders breaking their own rules 76% of the time. No human reviews their own work at that rate.
On judgment — no. It can’t price a headline, can’t feel a fear-driven rally, can’t decide what a trade is worth to you. And used lazily, it will happily replace the learning that would have made you good.
So the honest answer: AI reads the chart better. You still have to trade it better. The strongest setup is the one where both are true — a machine that never misses a confluence, checking the work of a human who actually understands why it matters.
Want to see what a deterministic read of your own chart looks like? Run a free analysis, no account needed. Expect to be told no a lot — it was the answer to 41% of last month’s reads, which is a fact about that month rather than a forecast about your chart. Decision support, not advice: you place the trade, ORIN grades the setup.
Questions this post answers
Can AI read trading charts better than a human?
At perception and measurement, yes: an engine checks every factor, level and timeframe on every read and never skips a step, which is where most human chart-reading errors live. At judgment, no: it cannot price a headline, feel a fear-driven rally, or decide what a trade is worth to you. The strongest process uses both.
Can I just screenshot my chart into ChatGPT?
You can, and as a second opinion it is genuinely useful. But a general model infers what your chart probably shows from pixels and will happily argue either side of it. A measurement engine computes structure, levels and momentum from the raw candle data first, and the same input always returns the same read.
Will an AI chart tool stop me from learning to trade?
It can, if you use the grade as an oracle and skip the reasoning. In one month of our data, about a quarter of analyses were the same person re-running the same chart within the hour — reassurance-seeking, not analysis. Read the evidence trail on every read and learn structure in parallel; the goal is predicting the grade before you see it.
Does ORIN publish a win rate?
No. Our live record stands at 33 resolved outcomes against the 100 the platform requires before confidence scores lean on live results rather than backtested replays, and a backtest uses simulated fills. A win rate published from a sample that small would be noise dressed as evidence, so it is not published.
Sources
2 citedThe documents this post leans on, linked to the issuing body rather than to a summary of it. Each line names the claim it stands behind.
- [1]CFTC — Customer Advisory: AI Won’t Turn Trading Bots into Money Machines
The claim that a signal service’s incentives run against yours, and which AI-trading promises the regulator tells retail clients to distrust.
cftc.gov · checked Sep 1, 2026
- [2]SEC — SEC Charges Two Investment Advisers with Making False and Misleading Statements About Their Use of Artificial Intelligence
That firms have already been charged for advertising AI capabilities they did not have — the reason this post states what the engine cannot do before what it can.
sec.gov · checked Sep 1, 2026
7 posts · all of them